
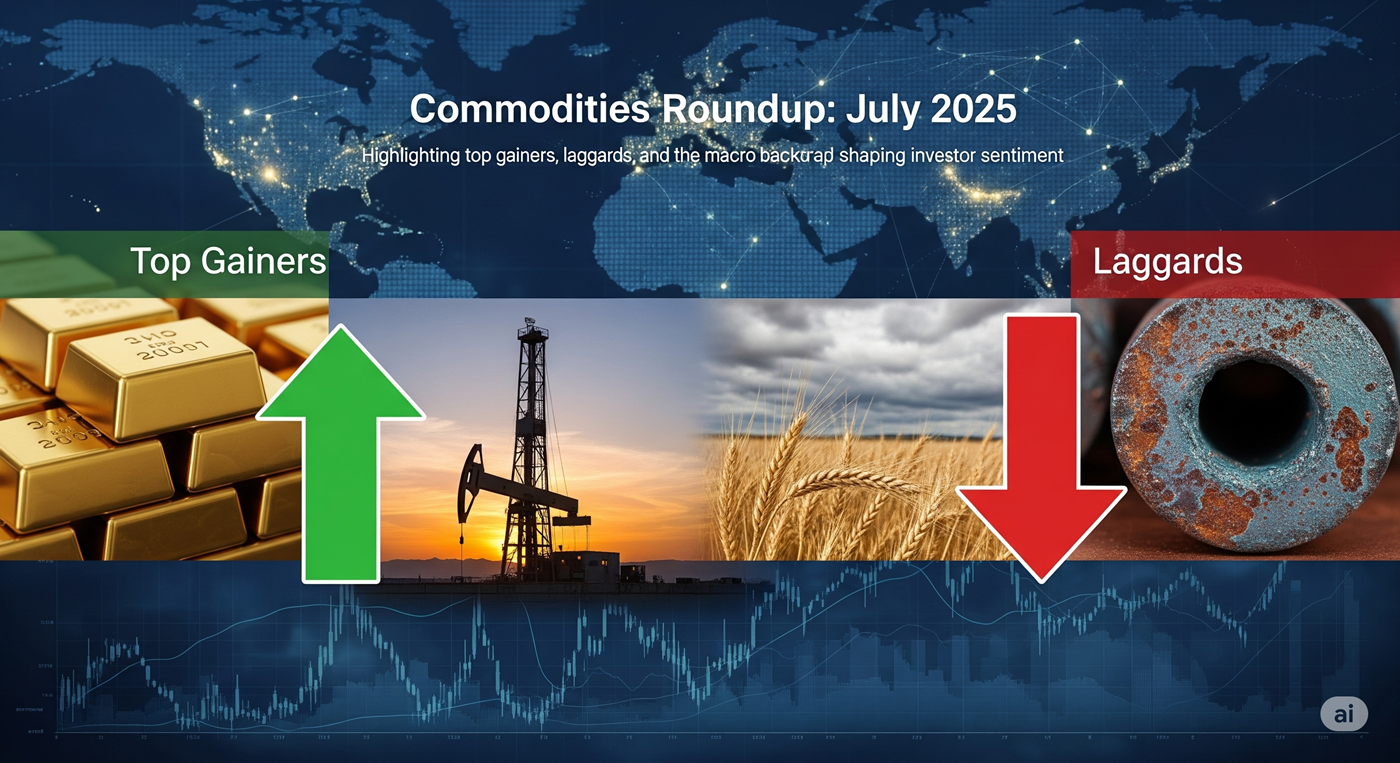
📊 Commodities Roundup: July 2025
Commodity markets delivered a mixed bag in July, with energy and precious metals outperforming, while industrial metals and agricultural commodities lagged. Seasonal factors and tariff-driven volatility contributed to sharp swings—especially in copper. Here’s what moved in July:
🔥 Top Performers
1. Oil (Brent & WTI)
- Brent prices surged ~13% over July, and WTI rose approximately 11%, according to the World Bank energy index. Prices closed near $84–85/barrel for Brent and $80–82 for WTI, their highest levels since April (Wikipedia, World Bank).
- The rally was fueled by OPEC+ production cuts, weakening U.S. dollar, tight supply—particularly from Libya and Nigeria—and bullish demand expectations (Wikipedia).
2. Gold & Silver
- Gold gained modestly for the week of July 21 but remained up nearly 27% year-to-date by mid‑year (lpl.com).
- Silver surged ~32% YTD, significantly outpacing gold, supported by strong industrial demand and safe-haven flows (Reuters).
3. Fertilizers
- According to World Bank data, fertilizer prices rose ~7.3% in June, signaling sustained demand heading into mid-summer (World Bank).
4. Some Agricultural Commodities (Coffee / Cocoa / Palm Oil)
- While July agriculture broadly softened, the World Bank and prior-year reviews indicate sustained strength in cocoa, coffee, and palm oil due to supply constraints and policy tailwinds—though fresh July entries were mixed (Reuters, Saxo).
📉 Underperformers & Weak Links
1. Copper
- The headline grabber of the month: U.S. copper futures plunged 17–22% in a single day after President Trump clarified that the 50% tariff would apply only to semi-finished copper products (like pipes and wires), not refined copper or cathodes (Reuters).
- Earlier speculative premiums between U.S. (Comex) and global (LME) pricing collapsed, causing massive losses for leveraged participants and a rapid unwind of positions built on tariff expectations (MarketWatch).
2. Corn
- Corn futures slid ~14% since February, entering the seasonally weak mid-June to mid-August period. Fund positioning turned heavily bearish with record short positions reported by the CFTC (Barron’s).
3. Natural Gas
- Natural gas posted sharp losses, dropping over 8% to 12% weekly, hitting new lows in the broader Bloomberg Noble gas index (lpl.com).
4. Broader Commodity Index
- The CRB (Commodity Research Bureau) Index fell ~1.8% on July 31, completing a soft month for commodity indices overall (barchart.com).
🧭 Sector-by-Sector Performance Table
| Category | Performance in July | Key Drivers |
|---|---|---|
| Energy (Oil) | +11–13% | OPEC+ cuts; tight supply; demand resilience |
| Precious Metals | Gold: modest gain; Silver strong | U.S. dollar decline; safe-haven; industrial demand |
| Industrial Metals (Copper) | −17% to −22% daily loss | Tariff reversal, speculative unwind |
| Grains (Corn, Wheat) | Corn: −14% YTD drop | Seasonal slump; bearish positioning |
| Fertilizers | +7.3% (June data) | Steady demand into crop planting season |
| Gas | −8–12% weekly | Oversupply, weak demand |
| CRB Index | −1.8% | Broad commodity weakness |
🔍 Key Market Drivers
Tariff-Induced Volatility
Trump’s unexpected limitation on copper tariffs triggered an abrupt end to speculative positioning, crashing prices nearly 22% in a single day and reversing weeks of gains fueled by tariff fears (Wall Street Journal, Barron’s, Wall Street Journal).
Macro Demand & Dollar Dynamics
- Oil and precious metals rallied partly due to weaker U.S. dollar, increased trade deal optimism, and OPEC-led supply management (lpl.com).
- CPI cooling and rate cut anticipation supported gold and silver as inflation hedges.
Seasonal and Supply Fundamentals
- Corn entered its typical summer slump, with seasonality combining with rising supply to push prices lower (Barron’s).
- Fertilizer demand rose thanks to planting season across key agricultural regions.
🧠 What It Means for Investors
✅ Strategic Takeaways
- Energy exposure benefited from macro tightness and policy tailwinds—those overweight in oil and related equities gained in July.
- Gold and silver proved their merit as diversifiers; spikes in silver reflect growing industrial usage beyond safe-haven demand.
- Copper’s plunge underscores risk in speculative trades: short-term price moves can overwhelm fundamentals when policy clarity suddenly arrives.
- Agricultural investors should note seasonality: price risk in corn and grains often peaks in mid-summer without supply shocks.
- Diversification remains key: broad commodity indices fell despite gains in select sub-sectors.
🔮 Looking Ahead: What July Portends for H2 2025
- Oil: If OPEC+ holds production discipline and global demand rises, prices may remain elevated, though economic softening poses a downside risk.
- Copper: A rebound is possible—but only if underlying demand from energy transition remains strong. Most models caution further price weakness absent clear import strategies or new demand shock.
- Precious Metals: Continued Fed policy dovishness and trade volatility could lift gold and silver further. But if inflation reaccelerates, pricing may fluctuate.
- Agriculture: Corn and wheat may stay soft until supply restraints or weather disruptions emerge. Watch for early weather alerts in Brazil and U.S. Midwest.
- Natural Gas: Prices may stay depressed until seasonal demand or supply shocks emerge (e.g., extreme weather, export pipeline disruptions).
📌 Key Takeaway
July’s commodity action was defined by divergence between speculative momentum and fundamental resilience. Energy and precious metals delivered strong returns amid geopolitical tension and rate speculation, whereas industrial metals and grains suffered under tariff reversals and seasonal headwinds. Investors witnessed how swiftly sentiment shifts—especially in copper—can erase speculative trades overnight.
Looking ahead into H2 2025, the narrative will hinge on OPEC discipline, Fed trajectory, trade policy developments, and global demand fundamentals. Those cautious of volatility and policy risk may favor diversified commodity exposure or select energy and precious metals, while speculative pressure points remain in cyclical metals and agriculture.
Disclosure:
The information above is provided for educational and informational purposes only and does not constitute investment advice, trading advice, or a solicitation to buy or sell any financial instrument. All facts and figures should be independently verified; while we strive for accuracy, errors or omissions may occur. Past performance is not a guarantee of future results. Every investment carries risk, including the possible loss of principal. Always conduct your own research or consult a licensed financial professional before making any investment decision.